This page was generated from examples/ssebop.ipynb. Interactive online version: ![]()
SSEBop
[1]:
import matplotlib.pyplot as plt
from pynhd import NLDI

import pygeohydro as gh
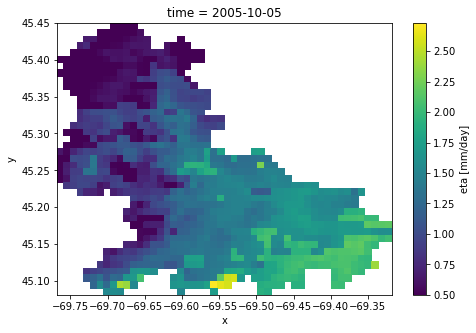
The daily actual evapotranspiration can be retrieved from SEEBop database. Note that since this service does not offer a web service and data are available as raster files on the server, so this function is not as fast as other functions and download speed might be the bottleneck.
You can get the actual ET for location using ssebopeta_byloc and for a region using ssebopeta_bygeom. Let’s get a watershed geometry using NLDI and then get the actual ET.
[2]:
geometry = NLDI().get_basins("01031500").geometry[0]
[3]:
dates = ("2005-10-01", "2005-10-05")
coords = (geometry.centroid.x, geometry.centroid.y)
eta_p = gh.ssebopeta_byloc(coords, dates=dates)
eta_g = gh.ssebopeta_bygeom(geometry, dates=dates)
[4]:
ax = eta_g.isel(time=4).plot(size=5)
ax.figure.savefig("../_static/eta.png", bbox_inches="tight", dpi=100)